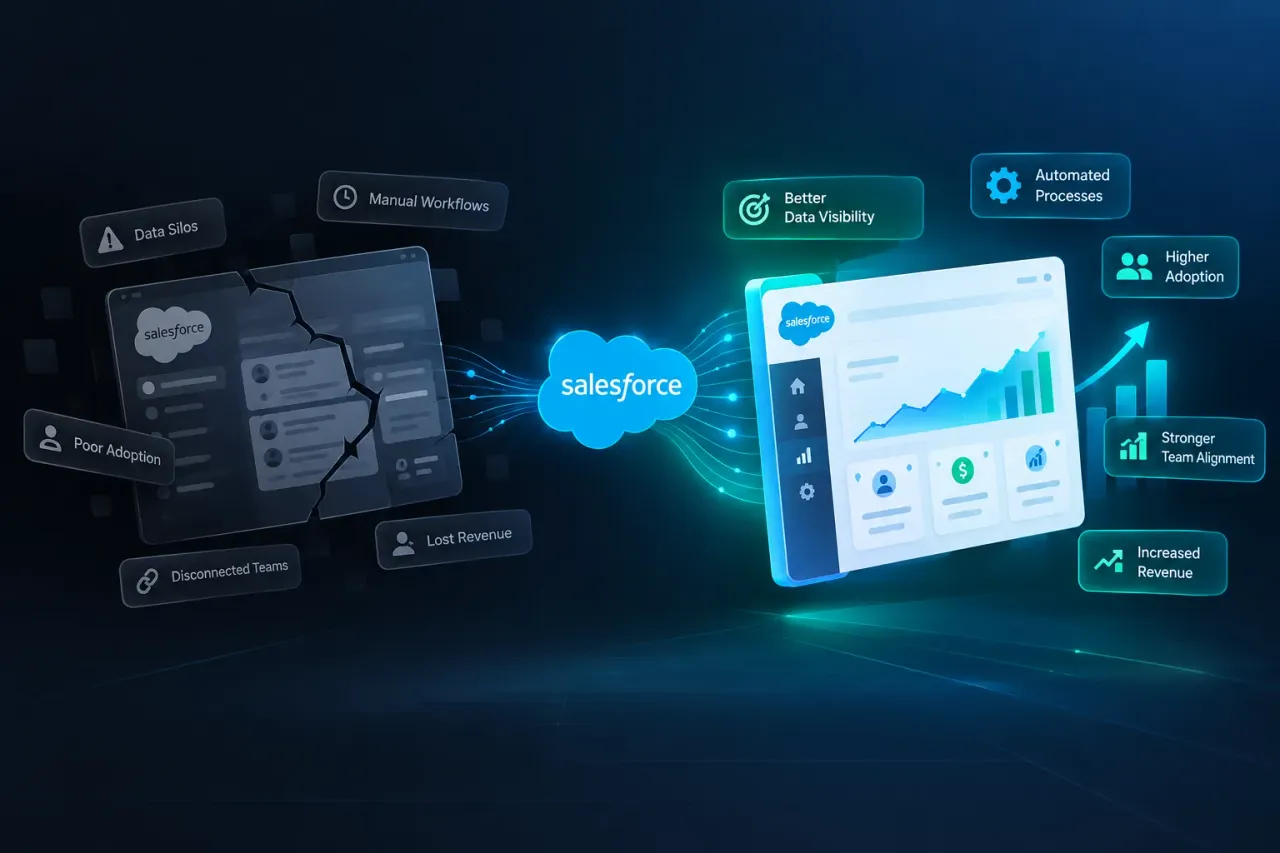
When a company describes their Salesforce implementation as “broken,” they rarely mean that the system does not function. Salesforce Sales Cloud is among the most advanced and capable sales solutions in the market. However, its real value depends on how well it is configured, adopted, and aligned with everyday sales processes.
It has the architecture, the ecosystem, and the flexibility to support virtually any B2B sales motion at virtually any scale. And yet, in a significant percentage of the organizations using it, it is functioning as an expensive contact database that people log into reluctantly and trust minimally.
The question I get asked most frequently by sales leaders in this situation is some version of: “We have invested significantly in Salesforce. Here is an honest answer, built on what I have seen work.
Diagnosing the Problem
Before any remediation begins, you need a clear diagnosis. Not a technology audit, but a business impact audit. The question is what business outcomes are being missed because of how Salesforce is currently configured and used.
Run through these diagnostic questions with your sales leadership team.
Can your sales manager produce an accurate forecast on any given day without manually adjusting Salesforce data.
Are your sales representatives spending more than five hours per week on CRM administrative tasks? If the answer is yes, you have an efficiency problem rooted in poor process design.
Is your win rate trending in the wrong direction despite consistent deal volume? You may have a pipeline stage and qualification problem: opportunities are moving through the funnel without meaningful qualification gates.
Do your sales reps have a complete picture of each account’s activity history, open opportunities, and support interactions within Salesforce? If not, you have a data model and integration problem.
The answers to these questions define your remediation priorities.
Fixing the Foundation
Every sustainable improvement to Salesforce Sales Cloud begins with the foundation: your data model, your sales process configuration, and your automation architecture.
Your data model should reflect the actual structure of your business. Are your Accounts properly segmented by tier, territory, and industry? Do your Opportunity records capture the information that actually predicts close probability? Are your custom objects and fields representing concepts that your team can define consistently?
If your data model was built in the early days of your Salesforce implementation without a clear architecture, the likelihood is high that it has grown organically in ways that create confusion and inconsistency. A data model review may not seem exciting or highly visible, but it is an essential first step for building a reliable system. Before automation, reporting, integrations, or user adoption can work properly, the data structure must be clear, accurate, and well organized. Everything else depends on that foundation.
Your sales process in Salesforce should reflect how your best reps actually sell, not how leadership wishes they sold. Map your pipeline stages to specific buyer decisions: the prospect has acknowledged the problem, the prospect has agreed to evaluate your solution, the prospect has signed a mutual action plan, and so on. Each stage should have an entry criterion that any rep can apply consistently.
When pipeline stages have clear, consistent entry criteria, forecast accuracy improves automatically. Leadership can trust the stage distribution because it reflects real buyer behavior rather than rep optimism.
Rebuilding for Productivity
Once the foundation is sound, the next priority is redesigning Salesforce for productivity: eliminating friction and automating routine work.
Conduct a field audit on your core objects. For each field, assess how often it is populated, whether it is actually used in reporting or automation, and whether it could be populated automatically rather than manually. Remove fields that serve no purpose. Automate population of fields that can be derived from other data. Simplify the visible layout so that reps see exactly what they need at each stage of the deal and nothing more.
Implement a complete email and calendar integration so that communication activity is captured automatically rather than manually. This single change typically recovers two to four hours of rep time per week while simultaneously improving the completeness of account and opportunity records.
Build automations that support the sales process: automatic task creation at stage progression, alerts to managers when deals stall, notifications when a high value opportunity has had no activity in a defined period. These automations remove the cognitive overhead of keeping track of everything manually and ensure that nothing important falls through.
Making It a Revenue Engine
The difference between a functioning Salesforce org and a true revenue engine is the quality and accessibility of the intelligence it generates.
A revenue engine gives sales leadership real time visibility into pipeline health, stage conversion rates, velocity, and win rate trends. It identifies the activities and behaviors that correlate with closed won outcomes so that managers can coach to what works.
Build your reporting architecture around the questions your leadership team asks every week. Not the questions they theoretically might ask, but the questions that come up in every forecast call and pipeline review. Create dashboards that answer those questions without requiring manual assembly.
Implement Sales Cloud Einstein or equivalent intelligence capabilities to surface predictive insights: which deals are most likely to close, which accounts are showing signals of expansion or churn risk, where in the pipeline your team is losing deals at a disproportionate rate.
Integrate your Salesforce data with your financial systems so that closed won opportunities automatically flow into revenue recognition, and your sales team has visibility into the health of their book of business from a revenue retention perspective.
The 90 Day Turnaround
A broken Salesforce org can be transformed into a revenue engine within 90 days with the right approach. The first 30 days are diagnostic and foundational: assess, prioritize, clean data, and simplify configuration. Days 31 through 60 are about automation and integration: build the productivity improvements and connect your data ecosystem. Days 61 through 90 are about intelligence and adoption: build the reporting layer, train the team, and establish the governance model that sustains the improvement.
At 90 days, you should be able to measure the difference in adoption rates, pipeline data quality, time spent on administrative tasks, and forecast accuracy. These metrics are the leading indicators of the revenue outcomes that will follow.
Salesforce Sales Cloud is capable of being the most powerful asset in your revenue organization. Whether it becomes that asset depends not on the platform, but on how intentionally you design and build within it.
The Mindset Shift That Changes Everything
The organizations that successfully transform Salesforce from a broken CRM into a genuine revenue engine share one common characteristic: they stop thinking of Salesforce as an IT system and start thinking of it as the operating system of their revenue organization.
When a sales leader treats Salesforce with the same strategic seriousness as their headcount plan or their compensation structure, the decisions made about the platform reflect that seriousness. They invest in proper architecture. They hold the team accountable for data quality. They use Salesforce data in leadership conversations rather than reverting to slides assembled from spreadsheets. They prioritize adoption as a business outcome rather than treating it as a technical metric.
This mindset shift changes what gets funded, what gets prioritized, and what gets measured. It creates alignment between the business objectives the platform is meant to serve and the decisions made about how to configure, maintain, and evolve it.
The technical work of fixing a broken Salesforce CRM is meaningful and necessary. But the organizations that sustain the improvement and continue to extract increasing value from the platform are the ones where leadership treats the platform as a strategic asset worth protecting and investing in overtime. That combination of technical excellence and executive commitment is what turns Salesforce Sales Cloud into the revenue engine it was designed to be.
They are intended for B2B business leaders, sales operations professionals, and revenue executives evaluating or optimizing their Salesforce investment.